13.1 HMI logs
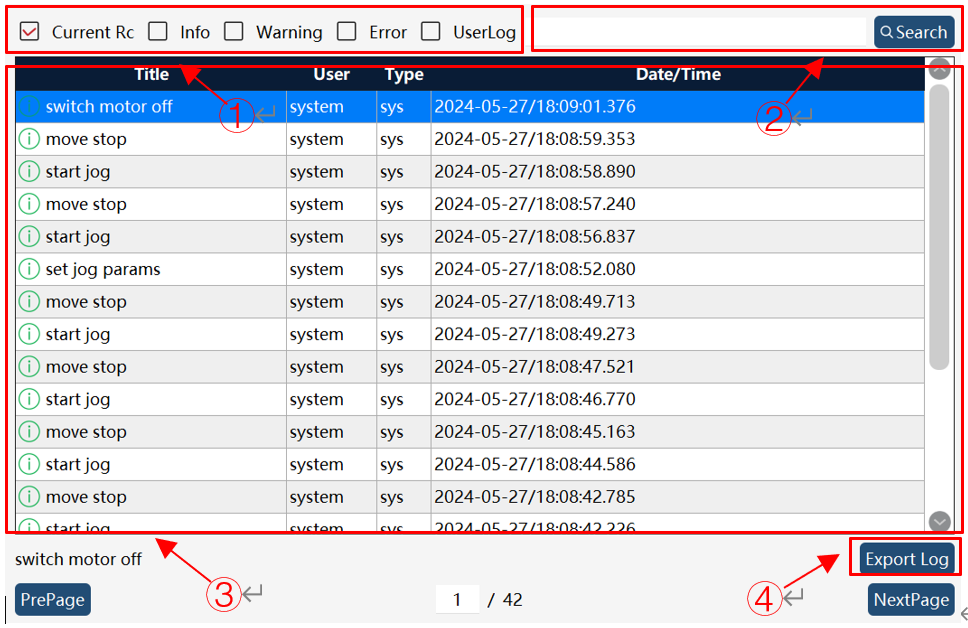
The HMI logs interface displays the current user’s HMI operation log information, and this interface includes filtering criteria area, search area, display page, etc. The user can click "Export Log" to export the desired HMI log information.
① |
Filtering criteria area, where the user can choose to view only the controller logs of the current controller or the ones connected to the HMI, as well as select the log level for further filtering. |
② |
Search area, where the logs can be searched by the input of keywords. |
③ |
Log display page, where log title, user, type, and generation time are displayed. The previous and next pages can be switched by clicking on "Previous/Next" buttons. |
④ |
The "Export Log" button can be clicked to export the log to a CSV format file. |
13.2 Controller logs
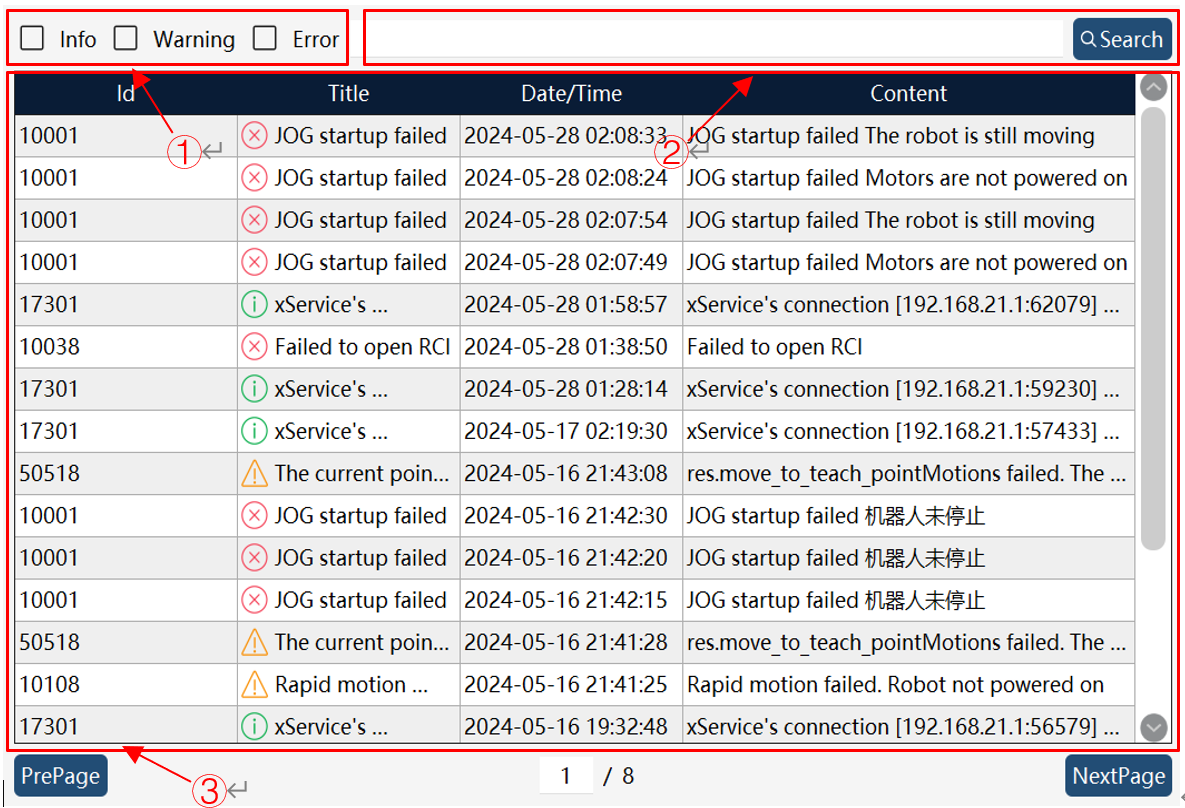
The controller logs interface displays the controller log information of the current robot, and this interface includes filtering criteria area, search area, and display page. The User can view the controller log information here.
① |
Filtering criteria area, where the user can select log level for further filtering. |
② |
Search area, where the logs can be searched by the input of keywords. |
③ |
Log display page, where basic information such as log number, title, generation time, and content is displayed. The user can press Previous/Next to switch between the previous and next pages. |
13.3 Operation logs
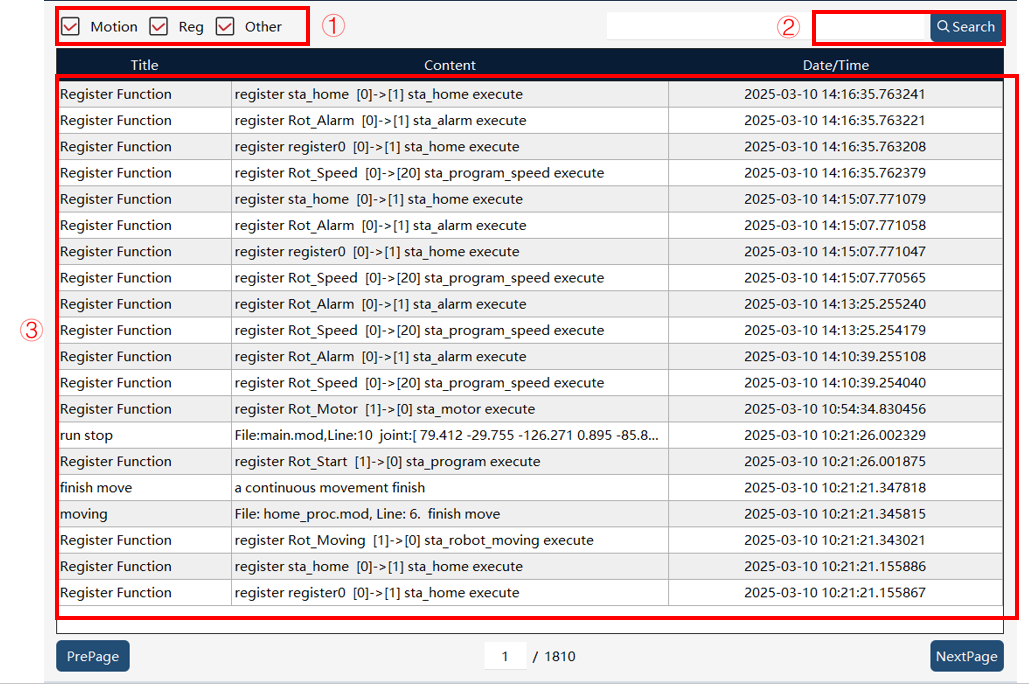
Compared with controller logs, operation logs mainly record the key commands that the robot has executed, including the following information:
-
Start and stop of the robot and execution of motion commands
-
Execution of two logical commands IF-ELSE and WAIT UNTIL
-
Execution of commands SetDO+PulseReg+PulseDO
-
JOG, drag, and regain path
-
Emergency stop, pause, and start
-
Register status codes output externally, and control codes received from external controllers
-
Changes in safe regions
-
Triggering of functions such as collision detection and diagnostic data saving
-
External data read by communication commands
① |
Filtering criteria area, where the user can select log level for further filtering. |
② |
Search area, where the logs can be searched by the input of keywords. |
③ |
Log display page, where basic information such as title, generation time, and content is displayed. The user can press Previous/Next to switch between the previous and next pages. |
13.4 Log timeline
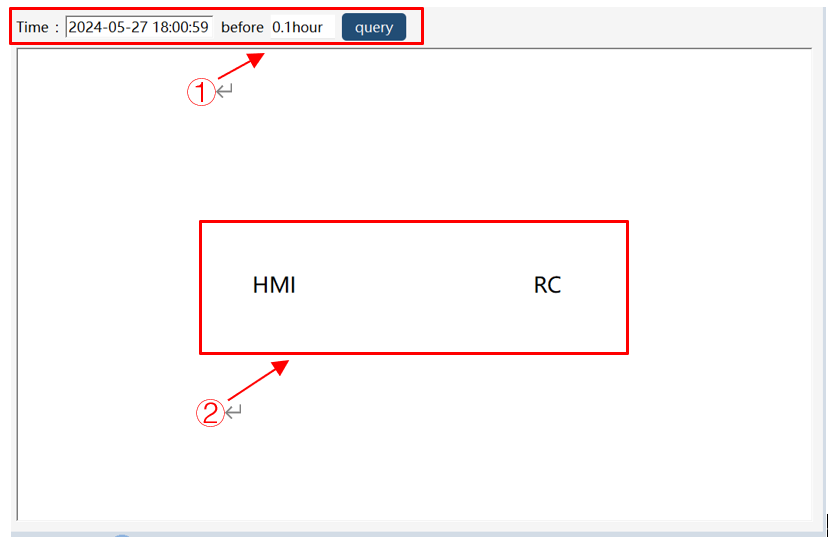
The log timeline interface displays both HMI and controller log information in chronological order, and this interface includes search area and display page, allowing the user to search for HMI logs and controller logs at different time periods.
① |
Search area, where the user can search logs with a specific time range |
② |
Log display page, where HMI logs are displayed on the left and RC logs on the right |
13.5 Internal logs
The internal logs interface has functions such as providing a basis for troubleshooting technical issues, robot malfunctions, etc. and pinpointing the cause of problems, and this interface mainly includes search area and display page.
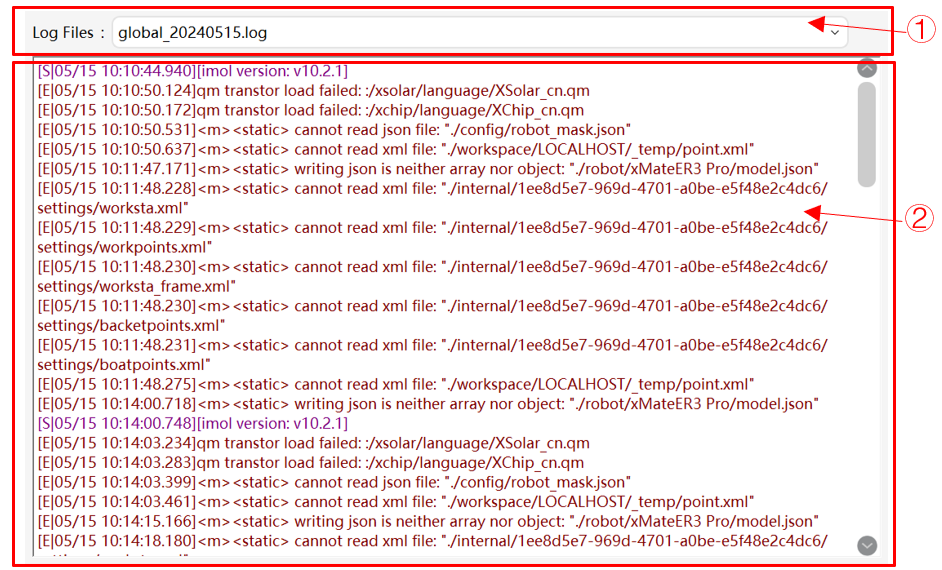
① |
Internal logs search area |
② |
Internal logs display page |
13.6 Hardware status
It is used to monitor the hardware status of the IPC and the teach pendant, including memory usage, disk usage, network adapter status, CPU frequency, temperature, and usage. The interface consists of an enable switch, an IPC hardware status display area, and a teach pendant hardware status display area.
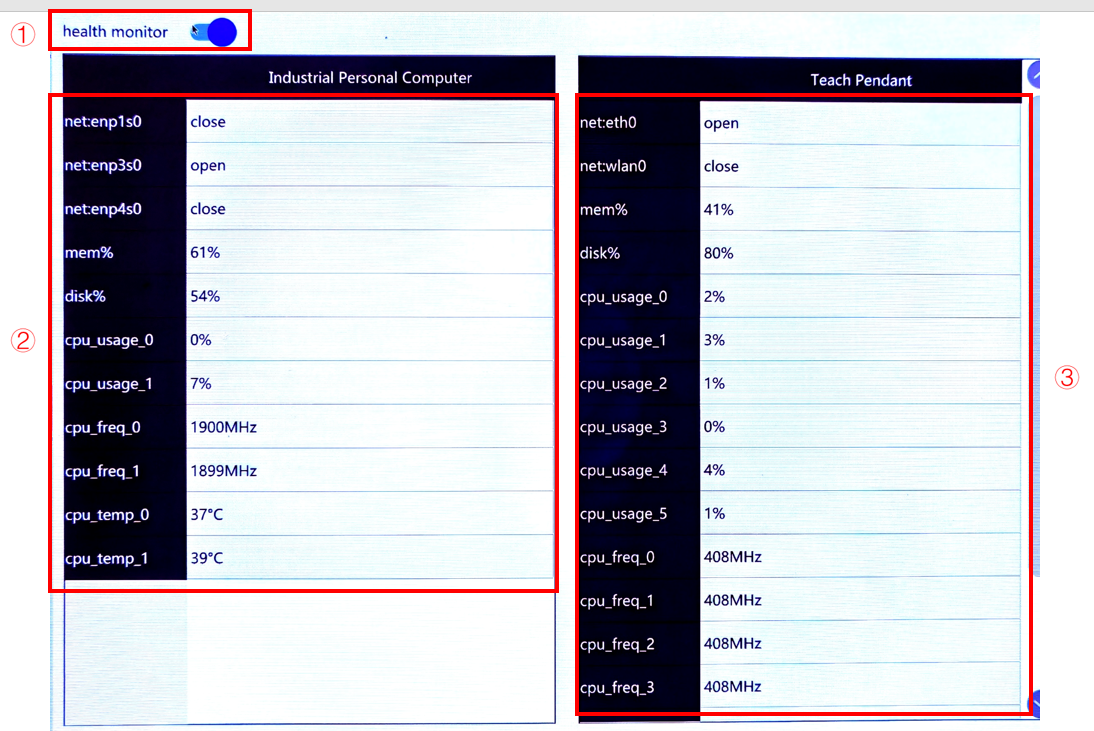
① |
Hardware status monitoring switch |
② |
IPC hardware status display area |
③ |
Teach pendant hardware status display area |
13.7 Diagnostic setting
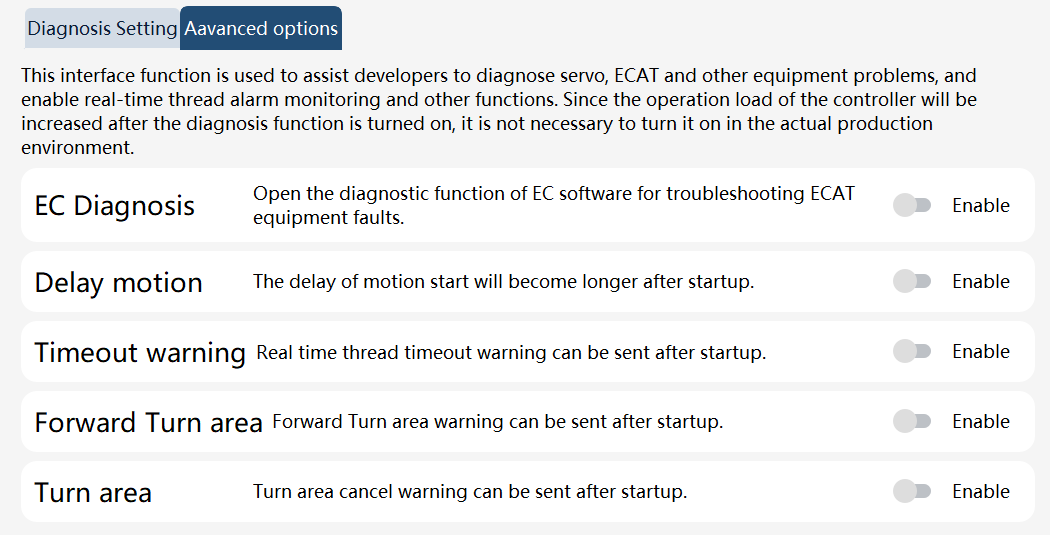
This interface is used to assist developers with the diagnosis of the servo, ECAT, and other equipment, and enable real-time thread alarm and monitoring and other functions. Since enabling the diagnostic function will increase the workload of the controller, do not turn it on in actual production unless necessary.
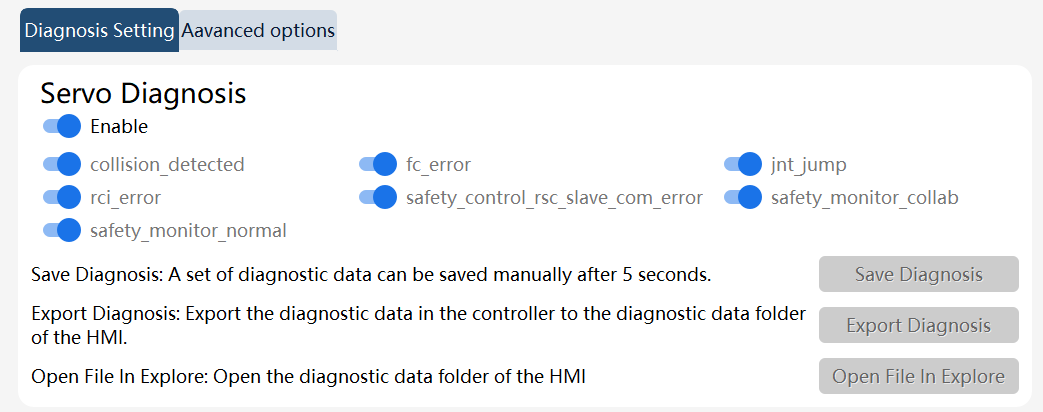
Servo diagnosis |
The servo diagnostic module is used to save the data errors in the servo. Click the Save button. The diagnostic data can be exported after 5s. |
EC diagnosis |
The EC software diagnosis function can be used to assist in troubleshooting ECAT devices. |
Timeout warning |
It aims to send real-time thread timeout warnings after enabled. |
Turning zone |
It reports a turning zone warning after it is enabled. |
Delay motion |
The delay in motion will be prolonged after it is enabled. |
Lookahead turning zone |
It reports a lookahead turning zone warning after it is enabled; |
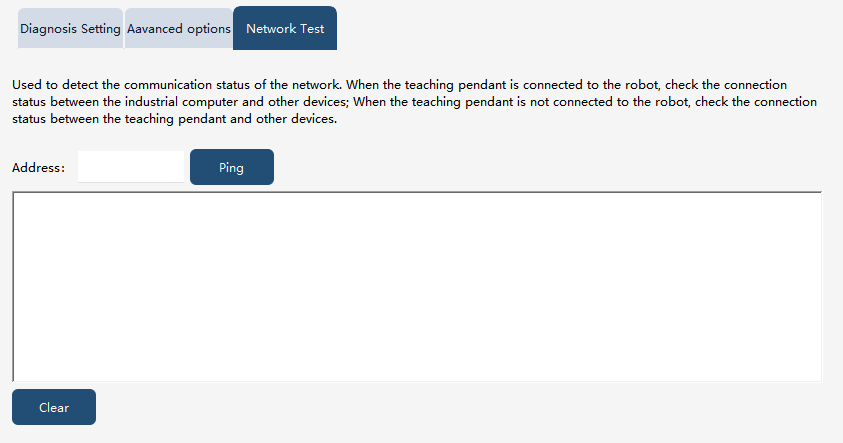
The network test is used to check the communication status between the industrial control computer of the robot and other devices, verifying whether the network is functioning properly. When the teach pendant is connected to the controller, it performs the controller network test function, which checks the network connection between the controller’s industrial control computer and other devices. When the teach pendant is not connected to the controller, it performs the teach pendant network test function, which checks the network connection between the teach pendant and the industrial control computer.
13.8 Working condition verification
The working condition verification function assists developers and field personnel in collecting machine status data during RL program execution for analyzing machine issues. This function is supported in the PC version of the HMI but not in the teach pendant HMI. In xCore 3.1, the export of collected data and curve plotting are no longer supported
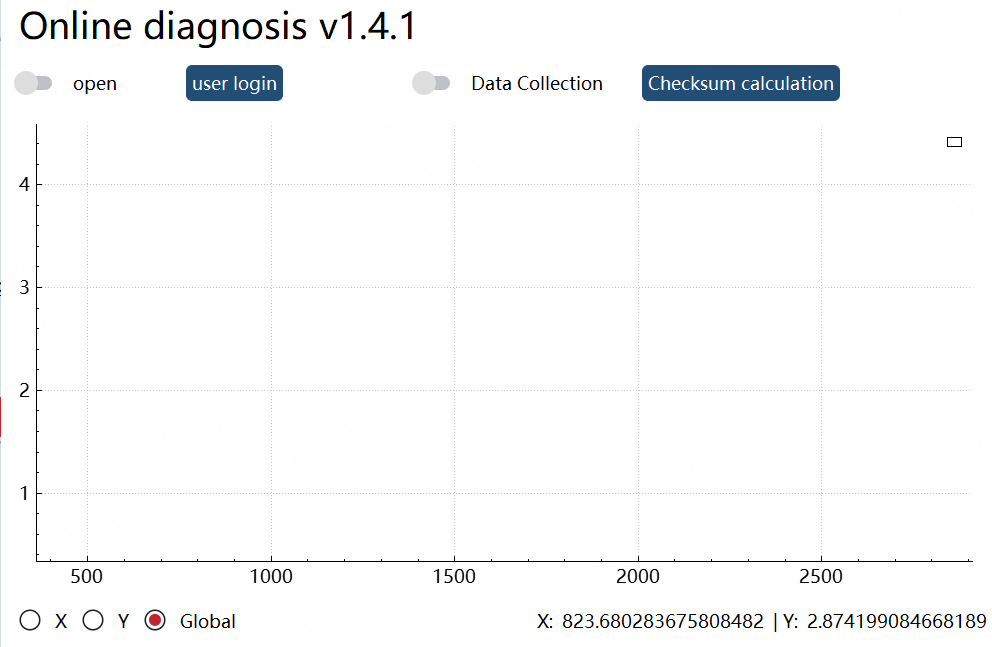
This function is located in the diagnostic data monitoring page of the log module, where users can start data collection by clicking the data acquisition button during RL operation, stop collection by clicking the button again after task completion, and then click verification calculation to obtain the working condition analysis results.
13.9 Maintenance
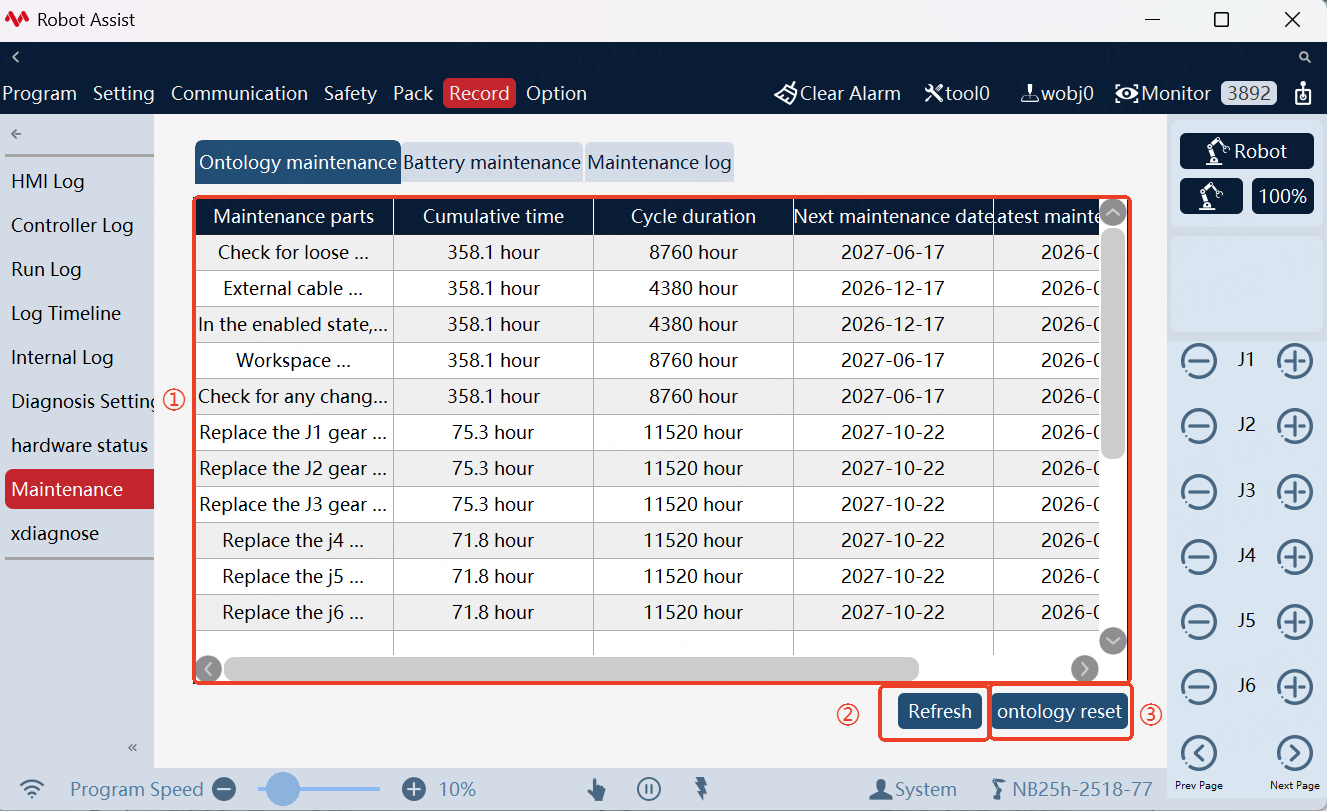
This function is used to record the service time of each maintenance entry for the robot. When the service time reaches the specified threshold, a pop-up window will appear as a prompt, and a corresponding IO signal will be output (the prompts are generally issued one week before the due date; if maintenance is overdue, prompts will be issued daily), so as to remind the user to perform protective maintenance on the robot. After the technician completes the actual maintenance, they will reset the service time of each maintenance entry and output IO signal. Only industrial models support maintenance.
① |
The current displayed body maintenance entries of the machine include maintenance components, cumulative duration (startup duration), cycle duration (maintenance cycle), next maintenance date (this date is adjustable and calculated based on the current system time, cycle duration, and cumulative duration), and the latest maintenance date (the most recent reset time). Reset button: Reset the cumulative duration of the corresponding entry, update the latest maintenance date to the current reset time, and recalculate the next maintenance date. |
② |
Refresh button: Refresh the displayed information on the interface. |
③ |
Body reset button: Reset all current body maintenance entries of the machine, with the same effect as resetting a single entry. |
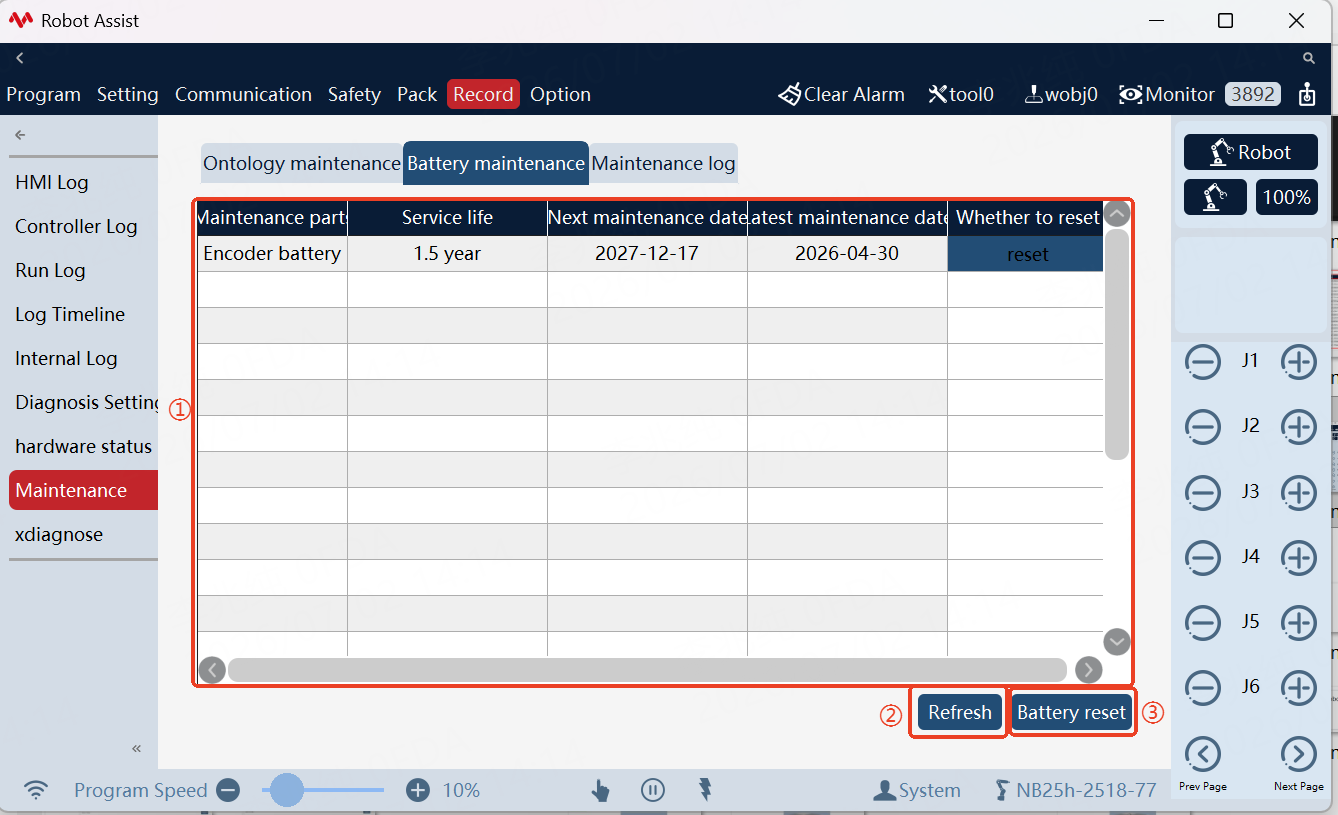
① |
The current displayed battery maintenance entries of the machine include maintenance components, service life, next maintenance date (calculated in the same way as the body maintenance entries, and the latest maintenance date (the most recent reset time). Reset button: Reset the cumulative duration of the corresponding entry, update the latest maintenance date to the current reset time, and recalculate the next maintenance date. |
② |
Refresh button: Refresh the displayed information on the interface. |
③ |
Battery reset button: Reset all current battery maintenance entries of the machine, with the same effect as resetting a single entry. |
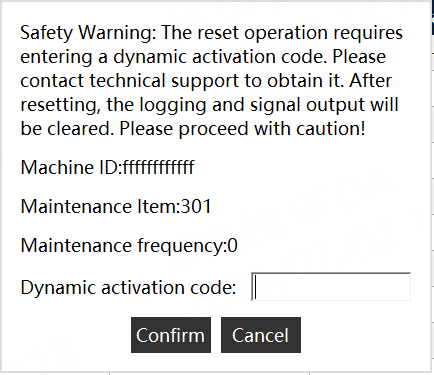
Performing a reset will trigger a reset pop-up window. It is necessary to contact the technical support personnel and provide relevant information, including the machine ID, maintenance entries, and the number of maintenance, to obtain a dynamic verification code for resetting. The reset can only be performed after entering the dynamic verification code. Generally, the reset is performed by maintenance personnel after maintenance. The details of the reset pop-up window are as follows:
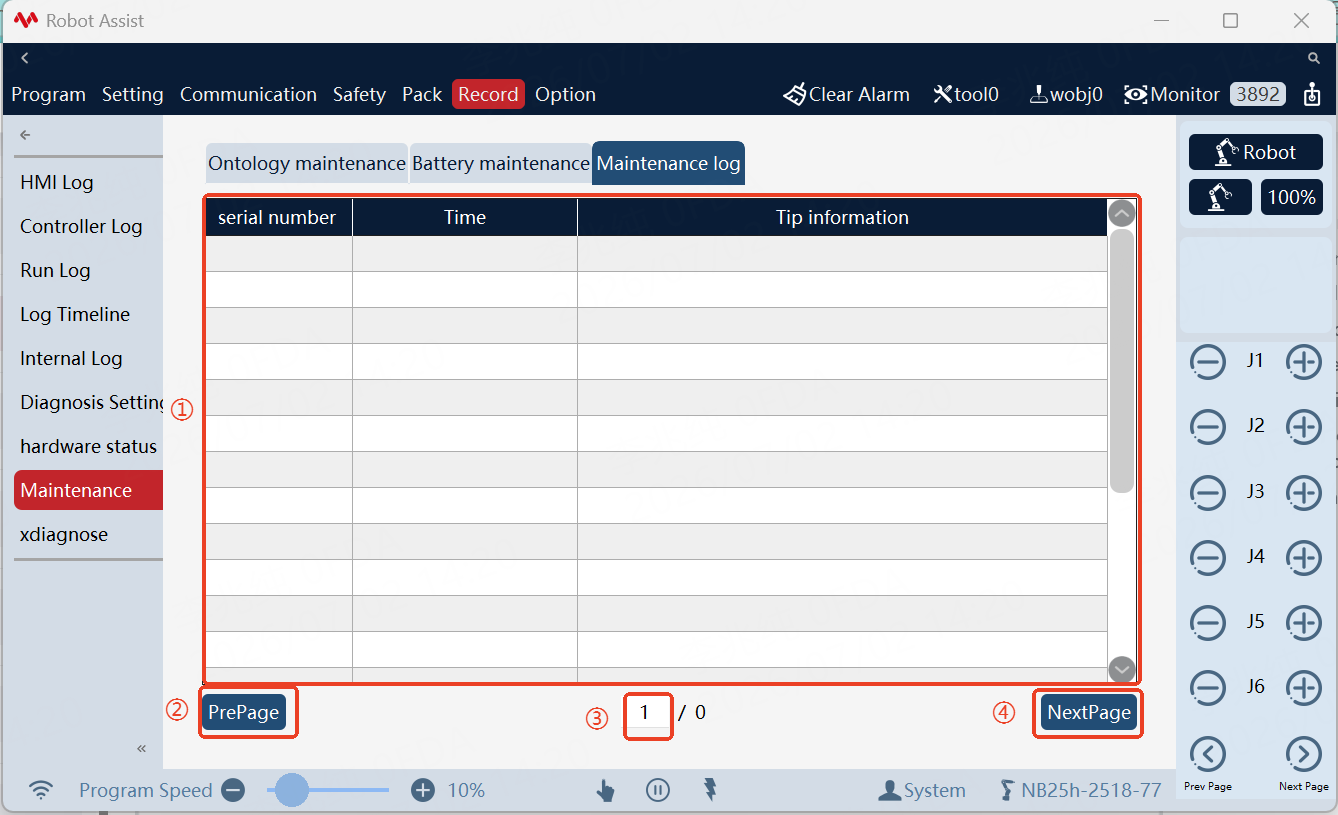
① |
Display the current maintenance log records of the machine, including serial number, time, and prompt information. Record the current maintenance status of the machine. |
② |
Back button: Search for the previous page of logs |
③ |
Jump: Enter the desired page number of the log to jump to that page |
④ |
Next button: Search for the next pages of logs |
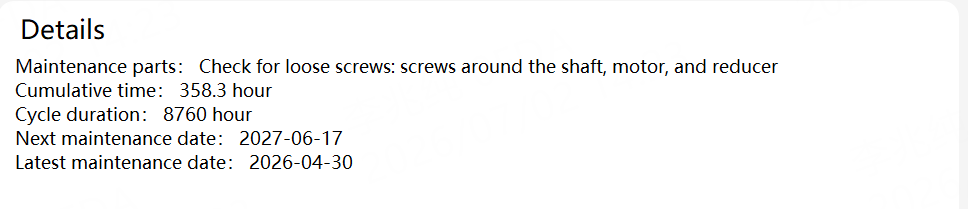
The above three pages can all be viewed for detailed information by clicking on the corresponding entry:
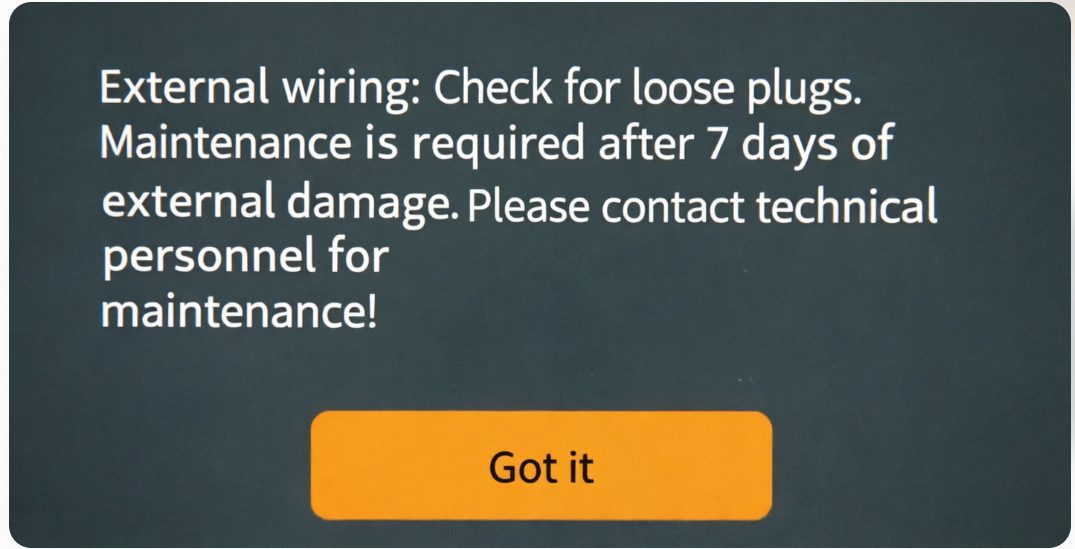
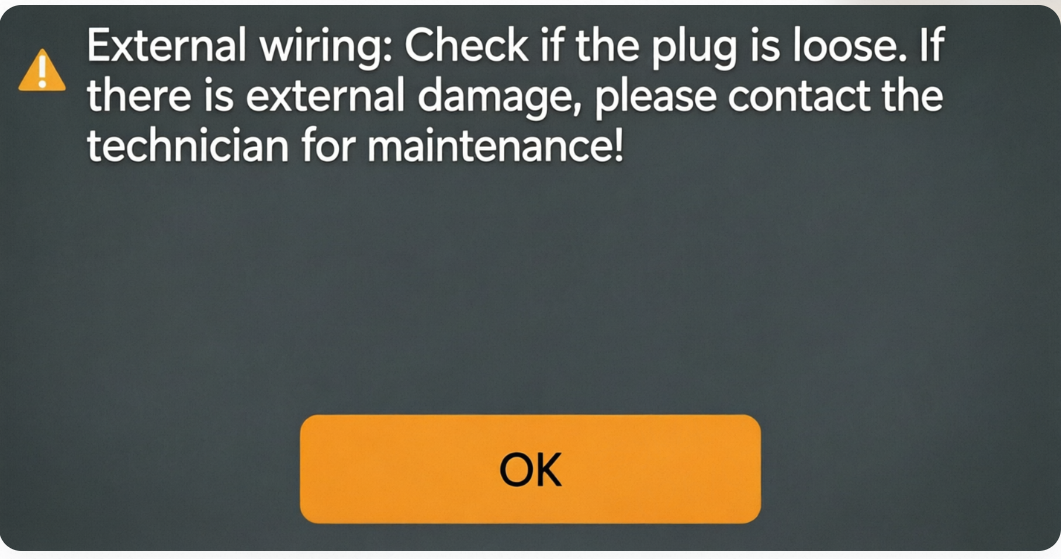
When the cumulative duration reaches the threshold, a pop-up window will appear in the lower right corner as a prompt. These prompts are generally divided into two types: beforehand prompts and expiration prompts. Beforehand prompts are issued one week (7 days) in advance, while expiration prompts are issued when the cumulative duration of the maintenance component reaches or exceeds the cycle duration. The prompt frequency is once a day. The prompt time is related to the last maintenance time. The left image shows a beforehand prompt, and the right image shows an expiration prompt.
##In addition to the pop-up window prompt in the bottom right corner, you can also bind system IO and register outputs to provide corresponding prompt signals:
Grease replacement alarm/ sta_grease |
The signal will be output when the grease in one or more axis reducers or axis gearboxes requires replacement |
Routine maintenance alarm/ sta_routine_maintenance |
The signal will be output when one or more routine maintenance items (excluding those related to grease and batteries) require maintenance |
Servo encoder low voltage alarm sta_encoder_low_battery |
Encoder battery |